Sarena Oberoi
April 19, 2020
Introduction
The Ebola virus is an extremely dangerous disease that targets the organs, the immune system, and causes excessive bleeding. Since the Ebola virus targets so many specific parts of the body (including white blood cells), the disease is extremely fatal with no guaranteed treatment (4). Although scientists are researching various treatment plans and cures, the fatality rate is currently very high. During the time of the epidemic, there was a dramatic decline in the economies of the countries affected. Trading and tourism were also greatly affected which directly resulted in a large regression of the economy. Furthermore, peoples freedoms were being restricted, as citizens were unable to go about their everyday lives including going to their jobs. It is important to address the epidemic in order to see economic success and make the citizens feel safe in their home countries once again. In America, medical technologies are extremely advanced and there are a great deal of sophisticated infection control policies. Unfortunately, the quality of life and medical technologies are not as refined in Western Africa which makes the disease more transmissible. Those with a stronger immune system typically have a better chance of survival, but this is unlikely in select countries in Africa (4). During the early months of 2014, the virus was very prevalent in many countries around the world including parts of West Africa such as Sierra Leone, Guinea, and Liberia, with each country observing a significant number of deaths due to the threatening virus (5). This paper will touch on a select few data science methods and recognize the effectiveness of each one. By using specific models and data such as the gravity model, impedance model, and radiation model, it is possible to identify specific covariates that are most critical in the spread of the Ebola virus. By analyzing the most common methods of tracking disease spread, it is possible to discover the most effective and efficient method, and further research the spread of diseases using this specific technique. In this paper, I will mainly focus on comparing the gravity model and the impedance model, but will also briefly touch on the radiation model (commonly used along with gravity model). By looking into these different models, the primary question I am aiming to answer is “what are the main factors that are most critical in the spread of the Ebola virus?” The first model I will discuss is the gravity model. This is a model that is used commonly to determine the interaction between two specific locations, or in other words, how certain populations travel or move within an area or areas (1,2). With the use of the gravity model, it is possible to see how a disease is moving from location to location, by analyzing the movement of people that have the disease, or may be carriers of it. The impedance model is comparable to the gravity model, in that it also aims to determine the movement of individuals from one location to another. Ohm’s law of electricity is the basis of the impedance model, in which the electrical variables are converted to variables regarding movement and mobility (1). Lastly, the radiation model is similar to both the gravity model and the impedance model, but it uses the laws of physics and the transfer of electromagnetic particles in order to track mobility instead (1).
Inquiry Type
The central questions regarding the transmission of Ebola can be answered using an explanatory inquiry. This explanatory inquiry is able to ask questions regarding why Ebola is spreading, and identify some of the primary causes of this rapid transmission. By tracking how humans are moving from area to area, these two models are able to pinpoint exactly where and how the virus is spreading in specific locations. Furthermore, the use of these models will give us a more comprehensive view of how the disease spreads from location to location and exactly how rapid the transmission is. By also looking into predictive gravity and impedance models it is possible to know where the disease is going prior to its spread. This can be very beneficial in implementing preventative measures before the disease surfaces in a new area. This inquiry type also aims to investigate which specific processes are involved in the spread of the disease itself. By using these models (along with other geospatial data methods) it is possible to see which covariates are allowing for the most rapid spread of the disease and aim to reduce the spread all together. One sub-research questions that I would like to ask is “which specific covariates are the most critical in the spread of the Ebola virus?” With this question, I am aiming to determine which variables are most commonly seen in areas where the Ebola Virus is the most prevalent and what we can do to decrease the spread of the disease. Another sub-research questions I am looking into is “How does population density effect the spread of the Ebola virus?” There has been a great deal of research done regarding how population density effects the Ebola virus. However, with the research being done, I have noticed that Ebola is not only commonly found in highly dense areas, but also remote areas that have lower population densities. This can also be tied back to the earlier research question regarding which covariates are at play with the virus. The last sub-research question I hope to answer is “how critical is human mobility in the spread of the Ebola virus?” In this paper I will describe models that aim to determine how the movement of individuals and populations effects the spread of the virus altogether. I will describe a few studies below in detail that outline the differences between the gravity and impedance model, and how each model provides a different angle and amount of accuracy regarding the mobility of humans.
Methods and Results
Gravity Model
The gravity model is a commonly used method that works to determine the movement of individuals between two specific areas, established on the basis of Newton’s law of gravity. In a specific study published in 2017, the accuracy of the gravity model was put to the test in order to see how well it performed compared to other tests (1,2).
A specific disease that is most commonly spread through contact with vegetation was studied using a gravity model. The goal of the model was to determine how human movement from distinct areas that were either in an urban area or vegetation area, effected the spread of the disease (2). Data from the Belgian Institute of Public Health was used to find predictive values regarding the transmission of the diseases, as well as information regarding who was at risk for the disease based on age and gender. There were also specific covariates that were identified such as characteristics of a variety of forests, the overall landscape of urban and vegetation areas, hunting, and animal production. Distances from urban areas to vegetation lands were obtained and mapped. The population densities of the towns studied were also recorded. These variables were placed into the gravity model equation. (2)
The gravity model is typically described using the equation expressed below, in which aij represents the force of attraction between two distinct points i and j; aij is proportional to mi and mj (massess of these specific areas), but inversely proportional to dij which is used to describe the distance between the two distinct points (2).
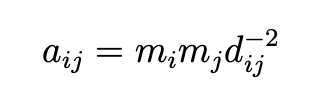
However, there was a more specific gravity model equation used in this study (modified to give more precise variables regarding disease spread):
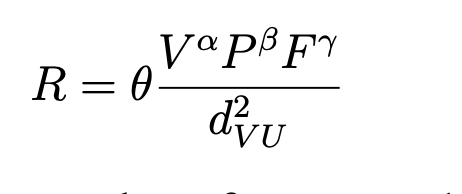
In which R represents a prediction of how many individuals are at risk for contracting the disease, V is the vegetation surface area, U is urban locations, P is the population, d is distance (from urban areas to vegetation areas), and the other variables represent distinct variables utilized in the model (2).
The results of the model showed that there were instances in which the gravity model underestimated the movement of individuals, and therefore the spread of the disease. However, the model was able to determine that the area with the highest risk of disease transmission was southern Belgium. The models showed that the areas with the highest residual values were also most at risk for contracting the disease. The graphs also portrayed that the gravity model predicted the spread of NE (one of the diseases studied), which was seen by it lining up fittingly with the root mean squared deviance in vegetation areas. That being said, the model showed that areas with high vegetation, were more at risk for the disease. In sum, the gravity model was able to provide a relatively accurate representation regarding how the movement of individuals from different locations effected the spread of the disease. Individuals involved in forestry/hunting activities in highly vegetated areas were more at risk for transmitting the disease from moving from area to area (2).
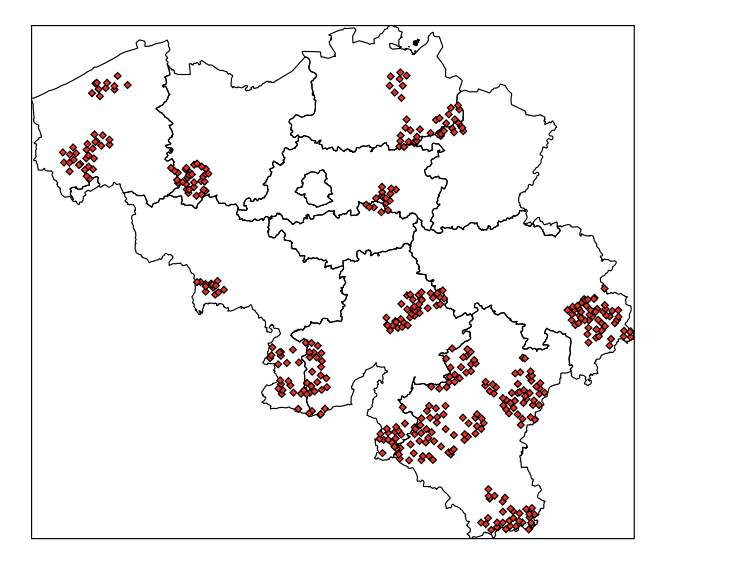
Figure 1: Areas marked in red are the towns/cities focused on in the gravity model.
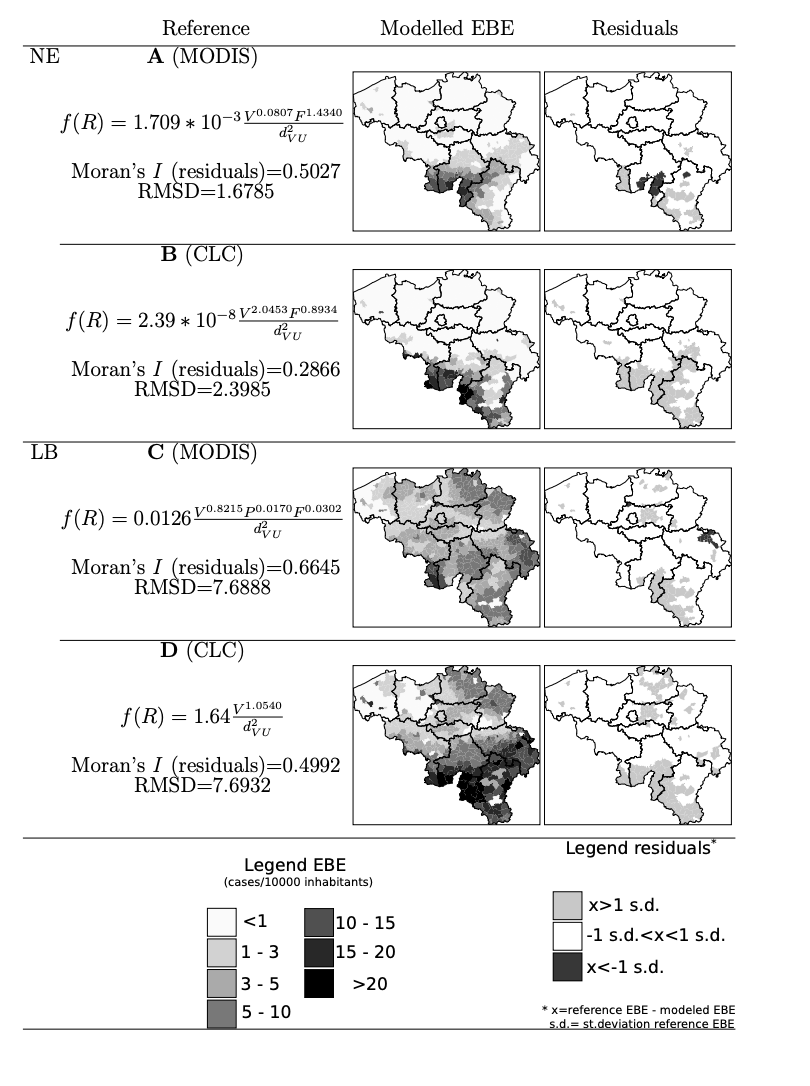
Figure 2: Models portraying the risk of disease transmission from areas with varying amounts of vegetation. The higher the residual, the more at risk the area is for disease transmission.
Impedance Model
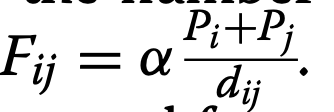
Another study introduced the impedance model along with the gravity and radiation model in order to see which model provided the most accurate prediction regarding disease transmission. In the impedance model (established on the basis of Ohm’s law of electricity), the electrical terms were converted to terms regarding human mobility. In the formula below, the term ‘d’ represents distance, ‘Fij’ represents the amount of trips taken a day from two specific locations ‘i’ and ‘j’, and ‘α’ and ‘p’ work together to represent the predictive values of population density (1).
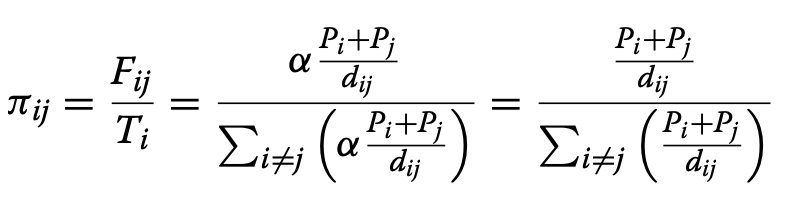
More specifically, in order to know what the probability of an individual moving from a specific location ‘i’ to a specific location ‘j’, another impedance model formula is used (1):
Three different scenarios were used in order to predict the mobility of humans: SPDD (source population and distance deterrence), SLDD (small to large population with distance deterrence) and LSDD (large to small population with distance deterrence). The average root mean square error (aRMSE) was obtained and compared in order to determine the most accurate model. The study focused on the cholera outbreak in Haiti in order to compare the effectiveness of the 3 models. First, data regarding the prevalence of the disease was obtained from the Ministry of Public Health and Population. This data was placed into a SIR model. The specific covariates focused on were those that were susceptible to the disease, infected, and recovered from the disease. To determine the mobility of individuals from specific location, CDR data was looked into in order to make a prediction (1). The impedance model resulted in the lowest aRMSE value of 7.19. The gravity model had a aRMSE value of 7.44, while the radiation model had a value of 8.40. When the population values were the same, the impedance model and gravity model worked equally well. However, as population values changed, the impedance value was seen to provide more accurate results. In the impedance model, there was an increase of approximately 5% in the aRMSE, with higher percent increases in the radiation and gravity models. Although the scenario results did not provide very specific information, they were beneficial in constructing hypotheses regarding human movement. Each scenario led to hypotheses that were solely focused on individuals (not populations). Research has shown that the transmission of diseases is based on much more than the individual and most commonly involves the movement of populations together. The CDR data also provided broad and inaccurate results (cell phone towers were not spread out evenly enough for specific results), leaving the impedance model as the most precise. By looking at the graphs and seeing which goodness-of-fit line fit the most appropriately, it was possible to determine which model was the most effective (1).
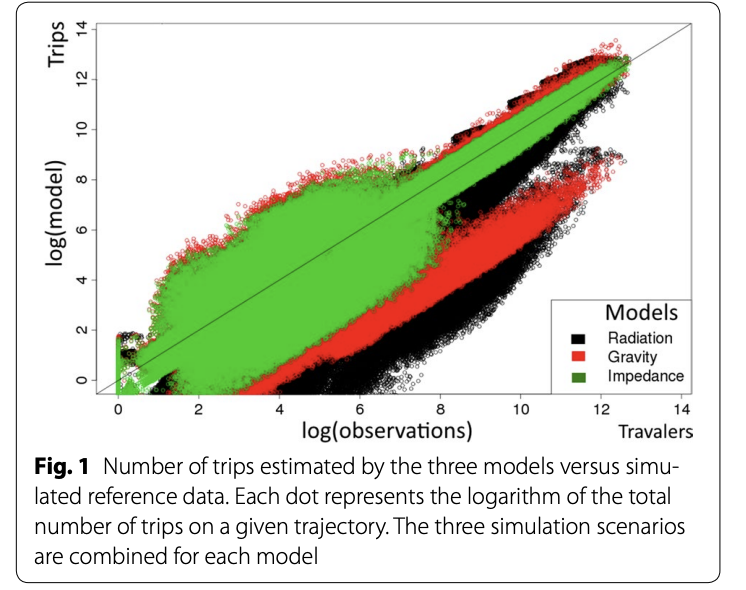
Figure 3: The radiation model (black), gravity (red), and impedance (green), all predict the amount of trips conducted.
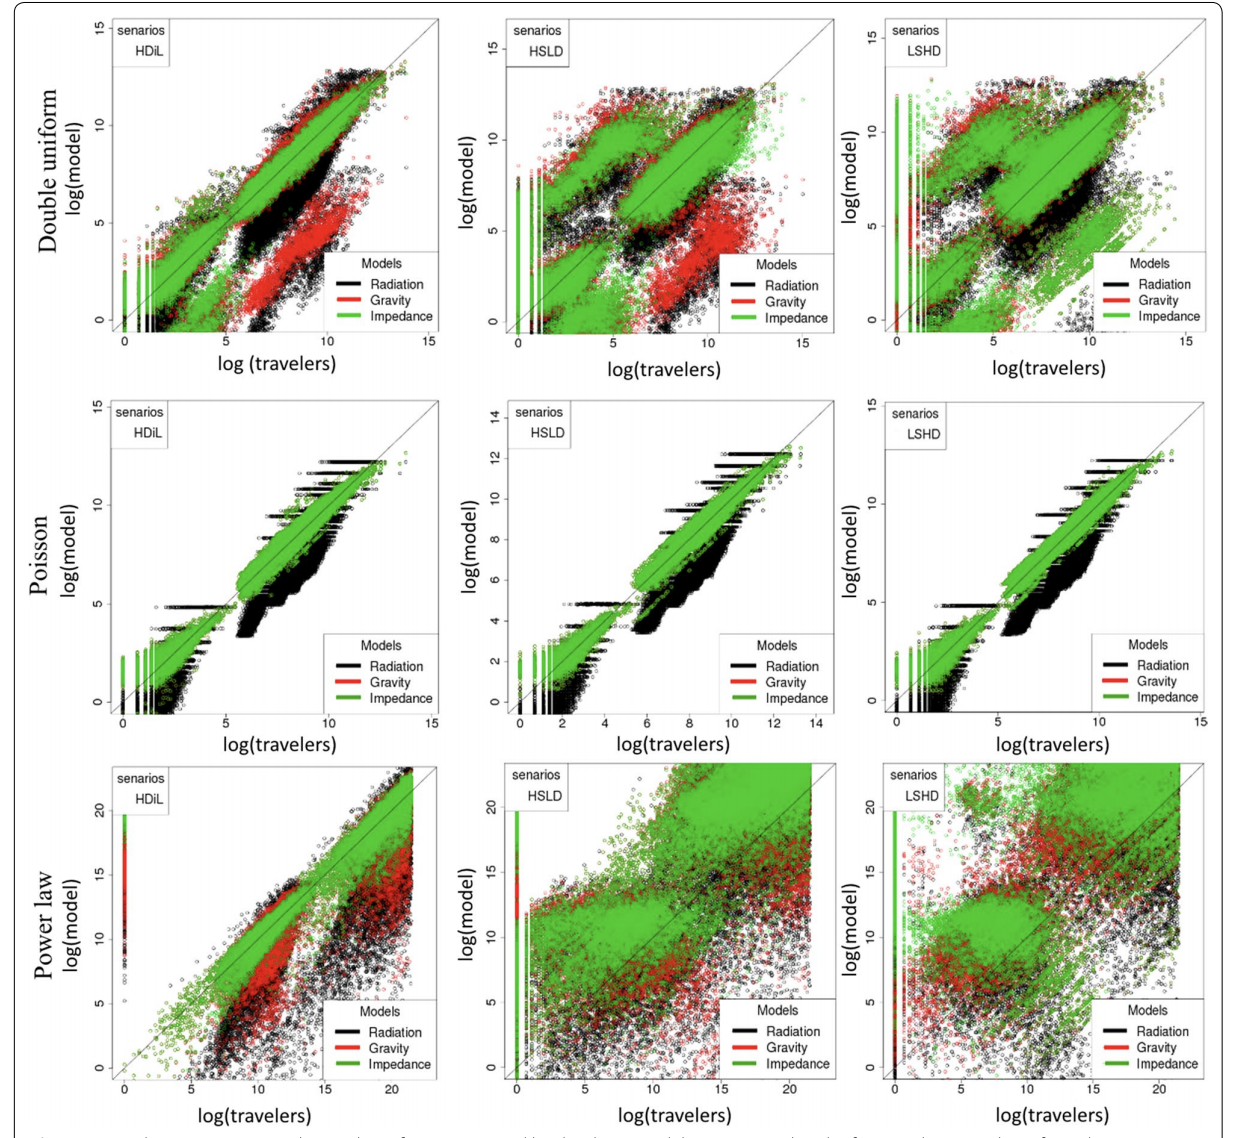
Figure 4: Scenario 1, 2, and 3 are graphed using each model (gravity, radiation, and impedance) to predict the amount of trips conducted (1).
Conclusion and Comparison
Compared to the radiation and gravity model, the data showed that the impedance model was the most accurate regarding the movement of individuals. The impedance model provided more accurate estimates for the movement of individuals for both short distances, as well as movement to areas with smaller populations. It seemed that there was a reduction of about 22% for the AIC (Akaike’s information criterion) when it came to the impedance model, but by even lower percentages for the gravity and radiation models (20% and 8.4%, respectively) (1). Furthermore, since the model that provides the smallest RMSE is known to be the most accurate predictor of population movement, the impedance model with a value of 7.19 was proved to be most accurate. The impedance model was also more precise when it came different sized populations and population densities. The research has shown that both the gravity model and impedance model worked well regarding the spatial data. On the other hand, the radiation model most commonly underestimated the amount of movement compared to the impedance and gravity model, which led to a number of problems when it comes to predicting the spread of disease (1). With the impedance model being more specific, it is possible to obtain more accurate data regarding where people are going within a country. For example, the other models are more broad which can lead researchers to making false or inaccurate conclusions. In sum, the impedance model was more accurate in predicting the values for diverse population densities. The other two models needed constant homogeneous populations, while the impedance model could work with heterogeneous populations. The study showed that even the CDR data didn’t work as well with predictions regarding the spread of the disease as the impedance model did. However, the CDR data did provide information regarding exactly how many trips were made from a specific location which was used in the impedance model to accurately predict movement (1).
Discussion
Based on the previous research done, the use of these geospatial datasets has been very beneficial in seeing which covariates are the most critical in the spread of the Ebola virus, as well as how the movement of individuals that involve these covariates effects the spread. Furthermore, according to the research I have done so far, it is evident that there are a variety of different methods that researchers have been using that not only provide significant evidence for how Ebola spreads, but how many diseases prevalent in today’s world spread as well. For example, along with CDR data and gravity models, researchers have made use of the random forest model in order to predict where a variety of diseases will go. Looking at the data I have researched, I have noticed that although researchers do look into different covariates, it seems that the covariates they are choosing to research are very narrow. I’ve noticed that a large gap seen in the literature, is that scientists are failing to recognize how a number of different covariates work in tandem with one another to spread the disease. I feel that it is important to interview individuals in order to gain insight regarding their own medical health. This could include gathering information regarding previous, as well as current health conditions. This way, it is possible to see who is most at risk of contracting the virus. Furthermore, gathering data on the sanitary habits of individuals living in Western Africa (or other countries that are at risk for the virus) could be very beneficial in identifying individuals that are more at risk for the Ebola virus. The models used to predict the movement of individuals have also proven to carry limitations. For example, in the articles I have read regarding the impedance and gravity model, the results showed that with some of the models (gravity), homogeneous population densities were needed in order to provide accurate results regarding movement of humans. In the real world it is quite difficult to find equally sized populations. Therefore, with the use of the impedance model which can predict movement for diversely sized populations, it is possible to accurately predict movement and disease spread (1). This can also be seen as a limitation, as it is difficult to find models that can correctly predict movement when factors are not constant. It is important for us to find new models, similar to the impedance model, that are able to make conclusions even with diverse and broad ranges of data.
Works Cited
1) Sallah, K., Giorgi, R., Bengtsson, L., Lu, X., Wetter, E., Adrien, P., . . . Gaudart, J. (2017). Mathematical models for predicting human mobility in the context of infectious disease spread: Introducing the impedance model. International Journal of Health Geographics, 16(1). doi:10.1186/s12942-017-0115-7
2) Barrios, J., Verstraeten, W., Maes, P., Aerts, J., Farifteh, J., & Coppin, P. (2012). Using the Gravity Model to Estimate the Spatial Spread of Vector-Borne Diseases. International Journal of Environmental Research and Public Health, 9(12), 4346-4364. doi:10.3390/ijerph9124346
3) Ebola virus disease. (World Health Organization). Retrieved April 19, 2020, from https://www.who.int/health-topics/ebola/
4) “2014-2016 Ebola Outbreak in West Africa.” Centers for Disease Control and Prevention, Centers for Disease Control and Prevention, 8 Mar. 2019, www.cdc.gov/vhf/ebola/history/2014-2016-outbreak/index.html.
5) Ebola Virus Disease Distribution Map: Cases of Ebola Virus Disease in Africa Since 1976. (2019, June 19). Center for Disease Control and Prevention. Retrieved from http://www.cdc.gov/vhf/ebola/history/distribution-map.html